Impact of the 2022 avian influenza epidemic in the US

Following 2015, the US was again hit by a devastating outbreak of the avian influenza virus in 2022. In the first 6 months of the year there was still some resemblance to what had happened in 2015, but its further course showed significant differences. Poultry World has done a detailed analysis of laying hen inventories, egg production and prices.
A closer look at 2022 showed that, strictly speaking, these were 2 separate waves of avian influenza, which also showed different spatial patterns. The aim of this article is to document the impact of the epidemic on laying hen inventories, egg production, the value of produced eggs at the farm gate and egg price in retail stores in the states mainly affected.
Timeline of outbreaks
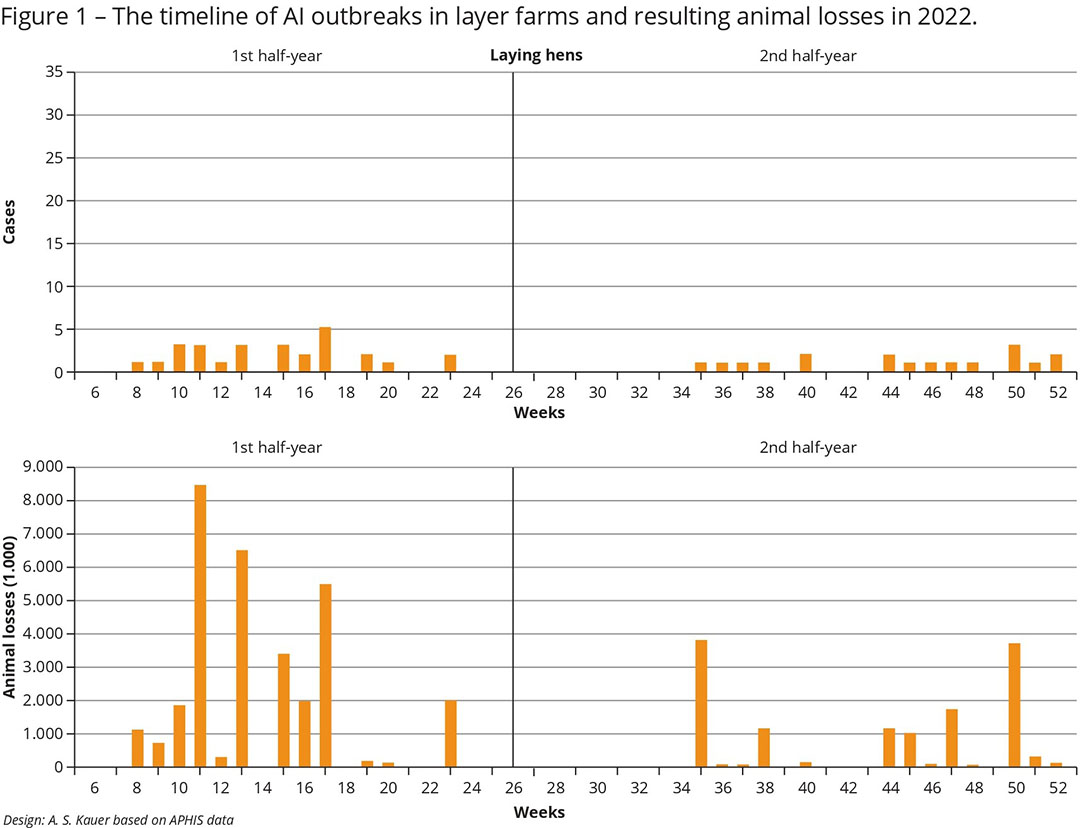
Figure 1 shows the timeline of the outbreaks in layer farms and the respective animal losses per outbreak. In 2022, a total of 45 outbreaks on laying hen farms was recorded, 27 of them in the first 6 months and 18 in the second 6 months of the year. The highest animal losses occurred between calendar weeks 11 and 17.

The average flock sizes of the affected farms differed considerably; 13 of the 45 affected farms had fewer than 100,000 hen places. These were mainly breeder farms for laying hens and broilers. By contrast, 21 farms had more than 1 million places, 2 even with more than 5 million. It is worth noting that farms with more than 5 million places were not infected in the second half-year. This is probably due to the fact that, after the events of the first half-year, farm managers improved the biosecurity of their farms or, on the other hand, if they were infected again they may not have been fully restocked when the epidemic flared.
Of the 57.6 million birds that died from the infection or were culled, 44.3 million were laying hens. In the first half-year, 31.4 million hens were lost, and in the second half-year 12.9 million. This difference is reflected in the development of the egg value at the farm gate and egg prices in retail stores.
Differences at state level
When analysing the impact on laying hen inventories, a distinction must be made between actual hen losses during the epidemic and annual changes. As can be seen from Table 1, the inventories nationwide decreased by 11.9 million birds between 1 December 2021 and 30 November 2022, while 44.3 million birds were lost during the epidemic.
A closer look at state level reveals that the inventories of the 7 most affected states declined by 17.3 million hens, or 14.9%. This shows that – because of the high losses in these states – egg farmers in other states placed more pullets to participate in the increasing egg prices.
A closer look at the data in Table 1 reveals that Iowa showed the highest absolute loss with 8.7 million birds, followed by Pennsylvania and Colorado. The highest relative decrease occurred in Colorado (31.6%), followed by Wisconsin and Iowa. It is worth noting that Iowa shared more than 50% in the reduction of the inventories in the 7 most affected states.
Considerable impact on production and value
A comparison of Table 1 and Table 2 shows that the percentage of egg production decreased at a lower rate than the hen inventory. The production volume in the 7 most affected states fell by 12.2%, and by only 1.7% in the US. Although the decline at national level seems to be marginal, the analysis of the egg price in retail stores shows that it increased dramatically. This is due to the fact that the production volume decreased considerably in several states, i.e., Iowa, Colorado and Nebraska, which played a major role in interstate egg trade.
Table 2 indicates that Iowa’s production volume fell by 2.8 billion eggs (18.6%) in the period under consideration. Colorado was even confronted with a relative decline of 32.8%. Wisconsin, Nebraska and South Dakota also showed high reduction rates. It is surprising at first glance that production volume increased in Pennsylvania. A glance at the timeline of outbreaks reveals that all outbreaks occurred in the first half-year. The farms could be completely restocked again and production reached full capacity earlier than in states with later outbreaks. In California, egg production decreased much less than in other affected states because only 715,000 hens were lost during the epidemic.
Due to the declining laying hen inventory and reduced egg production, the resulting egg shortage caused a drastic increase in the value of total egg production and the value per egg (Table 3). In the 7 most affected states the value grew by 140.8%, and in the US by 122.1%. However, the development differed considerably between states. Pennsylvania showed the highest relative increase at 243.2%, followed by Colorado and South Dakota.
In the 7 states, the average value per egg increased from 17.8 cents to 50.4 cents or by 283.1%. In the US as a whole, the growth rate was lower at 228.7% but nevertheless had a far-reaching impact on egg price in retail stores. It is worth noting that in 2022 the value per egg was highest in California at 64.1 cents. This is due to the state’s low level of egg self-sufficiency. About two thirds of the demand has to be imported while the Proposition 12 regulation, which does not permit the sale of eggs produced in conventional cages, contributed to the worsening of the situation. Companies and farmers that were not hit by the avian influenza virus made high profits. The net income of Cal Maine, the largest US egg-producing company, soared from US$39.5 million in March 2022 to US$323.2 million a year later.
Drastic increase in egg prices
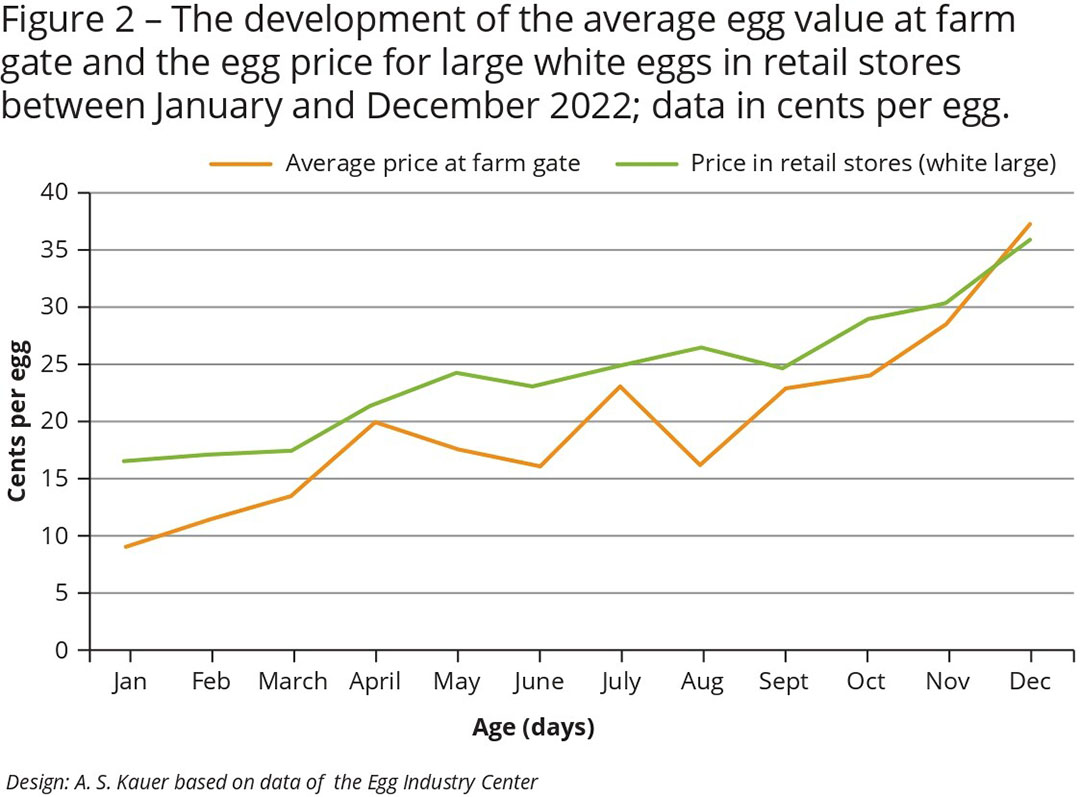
 The shortage of shell eggs for consumption and for further processing resulted in a drastic increase in egg prices paid at the farm gate and by consumers in retail stores. Figure 2 shows that the price at the farm gate increased from 9 cents per egg in January 2022 to 36.6 cents per egg in December. While the absolute growth during the first wave of the epidemic until June was only about 10 cents per egg, further outbreaks in the second half-year and the not yet completed restocking of farms infected in earlier months added to the critical situation, especially for egg processing companies that were even forced to import eggs from abroad. The sharp increase in November and December was due to the higher demand around Christmas and avian influenza outbreaks on large egg farms in Colorado. Over the whole year, egg price at the farm gate increased by almost 307%.
The 2 waves of the epidemic are also reflected in the egg price that consumers had to pay in retail stores. In the first half-year, the price grew by between 6 and 7 cents per egg. After a short plateau, prices rose again to reach a maximum of 40.2 cents per egg in January 2023. But it was not before March 2023 that prices decreased considerably.
Consumers in California had to pay up to US$6.72 per dozen in December 2022 due to the particular situation in that state. Because of the high price, per capita consumption decreased from 280.5 eggs in 2021 to 277.5 eggs in 2022.
Summary and prospects
During the avian influenza epidemic of 2022, over 44 million laying hens either died from the infection or were culled to prevent further spread of the disease. The drastic reduction in laying hen inventories in the most affected states led to a sharp reduction in egg production. This resulted in a considerable increase in the value of eggs at the farm gate and the price that consumers had to pay in retail stores.
The changing prices over the year reflect the 2 waves of the epidemic in the first and second half-year, respectively. It was not before the early months of 2023 that the situation began to stabilise. To prevent future epidemics of this dimension it will be necessary to consider the possibility of preventive vaccination.
References available on request.


